blog / · updated · 10 min read
What Infrastructure as Code Is and Why You Should Adopt It
Clicking in a portal does not scale, cannot be reviewed and leaves no history. What Infrastructure as Code is, the main tools, and how to start without breaking what already works.
Most infrastructure starts life as clicks in a portal. It works, until you need to rebuild it, explain it to an auditor, or find out who changed that firewall rule last Tuesday.
The traditional way: ClickOps
For most of IT history, infrastructure was built by hand: log into the cloud portal or the hypervisor console, click through the wizard, fill in the fields, press “Create”. Then SSH into the server and type commands until it works. It even has a name now, half joke and half accusation: ClickOps.
ClickOps is not stupid. It is the fastest way to build something once, the portal guides you, and you see the result immediately. For a one-off test or for learning a new service, it is perfectly fine.
The problem appears the second time. Imagine you need the same environment again: for staging, for a new client, or because the original was lost. What exactly did you click? Which options did you leave at their defaults, and which did you change? Which command did you run at two in the morning to make it work?
The only answer ClickOps has is documentation: write down every action, every value and every checkbox, with screenshots. That is slow, so it rarely gets done. When it does get done, it goes stale with the first change nobody records, and portals redesign their screens every few months anyway. Six months later, the document describes an environment that no longer exists, using buttons that are no longer there. The result is infrastructure that only exists in someone’s head, and an environment that nobody can rebuild with confidence.
I learned this the hard way. The first SIEM I inherited had been built 100% through ClickOps: integrations, pipelines, index policies and dashboards, all created by hand in Kibana, with no record of how. Nobody could tell me why things were configured the way they were, and rebuilding it was out of the question. That was the moment I understood I needed IaC, and the SIEM ended up redeployed as a Helm chart where every piece is in Git. I tell that story in a later article about building my first SIEM with Elastic.
What IaC is
Infrastructure as Code (IaC) means describing your infrastructure in files (networks, servers, databases, permissions) and letting a tool create and update it. Those files live in Git, so infrastructure gets the same things code gets: history, review, testing and automation.
It solves ClickOps’ main weakness directly: the code is the documentation. It cannot go stale, because it is what actually built the environment; if it does not match reality, the next run will tell you. Reproducing the setup is running the code again. A README still helps, to explain the why, the prerequisites and how to run it, but the what and the how live in the code itself.
Most IaC tools are declarative: you describe the end state you want (“there is a VM with these properties”), not the steps to get there, and the tool works out what to create, change or delete. That is what lets it handle changes as well as creation, and detect when reality drifted from the code.
The main tools
| Tool | Scope | Notes |
|---|---|---|
| Terraform | Multi-cloud and SaaS | Huge provider ecosystem; licence changed to BSL in 2023 |
| OpenTofu | Multi-cloud and SaaS | Open source fork of Terraform, compatible with it |
| Bicep / ARM | Azure only | First-party, no state file |
| CloudFormation | AWS only | First-party |
| Pulumi | Multi-cloud | Real programming languages instead of HCL |
| Ansible | Configuration | Better for what is inside the server than the server itself |
Why adopt it
- Reproducibility: rebuild an environment from scratch, identical, without a runbook of screenshots.
- Review: infrastructure changes go through pull requests.
- History: Git tells you who changed what and why.
- Audit evidence: change management and configuration baselines, for free.
- Speed: ten similar resources are a loop, not ten afternoons.
- Disaster recovery: your documentation is executable.
It is an investment
IaC is not free. Writing the code for a resource takes longer than clicking through the portal, at least the first time. Someone has to learn the tool, its state model and the quirks of each provider, and importing what already exists can take weeks. For a small team, that time comes out of everything else.
But it is an investment, and it pays off. The second environment costs a fraction of the first. Every change after that is faster, safer and reviewed. And the day you need to rebuild something in a hurry, or show an auditor how it is configured, the time you spent writing code comes back with interest.
A minimal example
resource "azurerm_resource_group" "blog" {
  name     = "rg-blog-weu"
  location = "westeurope"
  tags = {
    owner = "it"
  }
}
plan shows what will change; apply does it. Reviewing a plan before applying is the single most important habit in IaC.
A real example: Terraform, Ansible and Jenkins, end to end
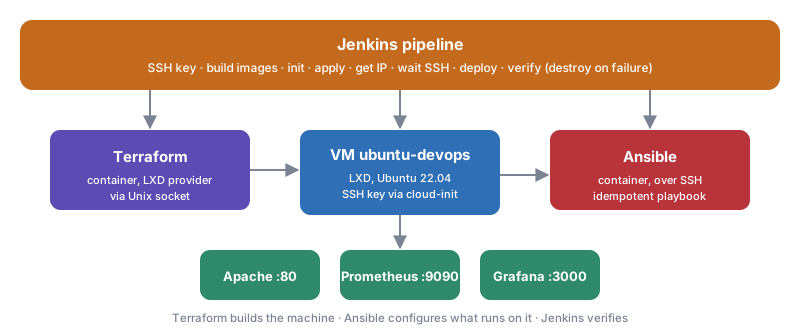
Theory is easy. To see how the pieces fit, here is a lab I built during my cybersecurity specialisation: a single Jenkins pipeline that creates a virtual machine with Terraform, configures it with Ansible and checks that everything works. The code is public at pixelotes/lab-jenkins-lxd (README in Spanish).
The architecture
- LXD on the host provides the virtual machine.
- Terraform runs in a Docker container and talks to LXD through its Unix socket, with no privileged mode and no HTTP API.
- Ansible runs in another container and configures the VM over SSH.
- Jenkins, in Docker Compose, orchestrates the whole thing.
Every tool runs in its own container with pinned versions, so the host only needs Docker and LXD. LXD also turned out to be a much simpler local hypervisor than VirtualBox or VMware for this kind of automation: Terraform drives it through a Unix socket, with no external server or remote API.
Terraform builds the machine
The whole VM is one resource. The SSH public key is injected on first boot through cloud-init:
resource "lxd_instance" "ubuntu" {
  name             = var.vm_name          # ubuntu-devops
  image            = "ubuntu:22.04"
  type             = var.vm_type          # virtual-machine
  wait_for_network = true

  limits = {
    cpu    = var.vm_cpus
    memory = "${var.vm_memory_mb}MB"
  }

  config = {
    "user.user-data" = templatefile("${path.module}/cloud-init.yaml.tpl", {
      ssh_public_key = var.ssh_public_key
    })
  }
}

output "vm_ip" {
  value = lxd_instance.ubuntu.ipv4_address
}
The key arrives as TF_VAR_ssh_public_key from the pipeline, so it never lives in the Terraform code.
Ansible configures what runs inside
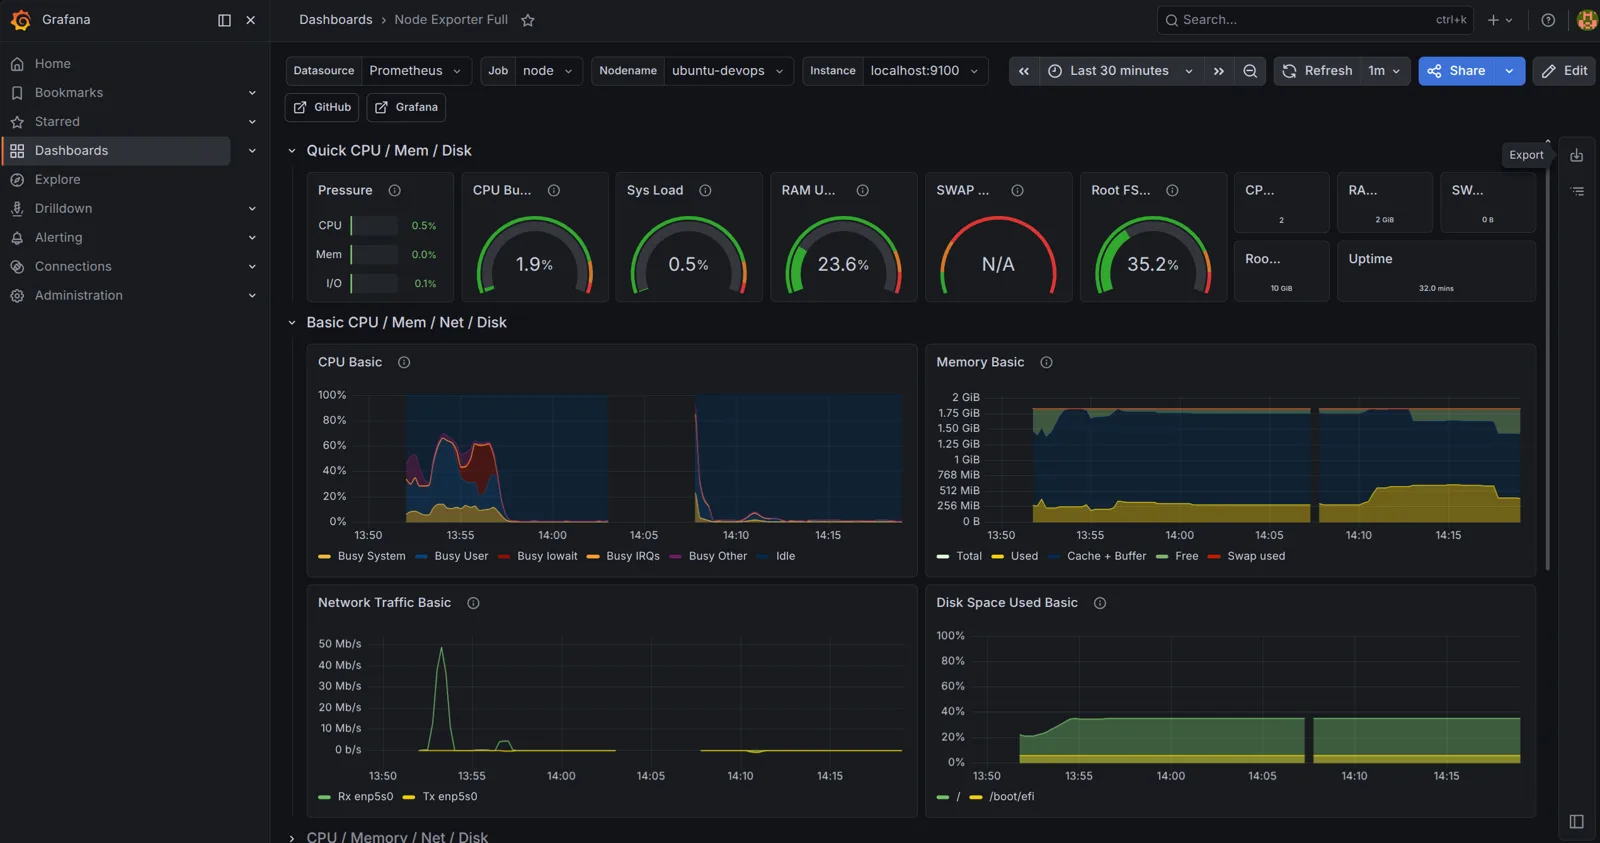
The playbook runs 19 tasks. It first waits for cloud-init and for unattended-upgrades to release the apt lock: Ubuntu cloud images start that process in the background on first boot, and without the wait every apt install fails with E: Could not get lock. Then it installs Apache, Prometheus with Node Exporter and Grafana from its official repository, wires Prometheus as Grafana’s data source through the API, imports the community “Node Exporter Full” dashboard (ID 1860), and verifies the three services itself.
Everything is idempotent: running it twice changes nothing the second time. A small detail shows how: when the playbook registers the data source, it accepts HTTP 409 as a valid answer, because 409 means “it already exists from a previous run”:
- name: Register Prometheus as a Grafana data source
  ansible.builtin.uri:
    url: http://localhost:3000/api/datasources
    method: POST
    user: admin
    password: "{{ grafana_admin_password }}"
    force_basic_auth: yes
    body_format: json
    body:
      name: Prometheus
      type: prometheus
      url: http://localhost:9090
      access: proxy
      isDefault: true
    status_code: [200, 409]    # 409 = already exists, which is fine
Jenkins orchestrates it
Jenkins itself is zero-touch. Its init.groovy.d directory is mounted into the container, and Jenkins runs every Groovy script there on boot: one disables the setup wizard (lab only, see below) and another reads the Jenkinsfile from the repository and creates the job. With Docker and LXD installed, docker compose up -d and one click on “Build” is all it takes. A full run takes between five and twelve minutes, depending on whether the tool images are already built.
The script that creates the job is short enough to show in full:
import jenkins.model.*
import org.jenkinsci.plugins.workflow.job.WorkflowJob
import org.jenkinsci.plugins.workflow.cps.CpsFlowDefinition

def instance = Jenkins.getInstance()
def job = instance.getItem("lab-devops-lxd") ?: instance.createProject(WorkflowJob, "lab-devops-lxd")

// The Jenkinsfile in the repository is the single source of truth for the job
job.setDefinition(new CpsFlowDefinition(new File('/workspace/Jenkinsfile').text, true))
job.save()
Because it runs on every boot, the job always matches the Jenkinsfile in the repository: the pipeline definition is code too.
The pipeline has eight stages:
| Stage | What it does |
|---|---|
| 0. SSH key | Generates a key pair for the lab if it does not exist |
| 1. Build | Builds the Terraform and Ansible images |
| 2. Terraform init | Downloads the LXD provider |
| 3. Terraform apply | Creates the VM |
| 4. VM IP | Reads the vm_ip output and writes the Ansible inventory |
| 5. Wait for SSH | Polls port 22 until the VM answers |
| 6. Ansible deploy | Runs the playbook |
| 7. Verify | curl against Apache, Prometheus and Grafana |
The most interesting stage is the one that glues the tools together. Terraform knows the VM’s IP only after creating it, and Ansible needs it in its inventory, so stage 4 reads the Terraform output and writes the inventory on the fly:
stage('4. Get VM IP') {
  steps {
    script {
      def vmIp = sh(
        script: "docker run --rm ... ${TF_IMAGE} output -raw vm_ip",
        returnStdout: true
      ).trim()
      env.VM_IP = vmIp

      writeFile file: "${env.WORKSPACE_DIR}/ansible/inventory.ini", text: """\
[web]
${vmIp} ansible_user=ubuntu ansible_ssh_private_key_file=/root/.ssh/id_rsa
"""
    }
  }
}
No IP is ever hard-coded: each run builds a new VM and the pipeline discovers where it landed.

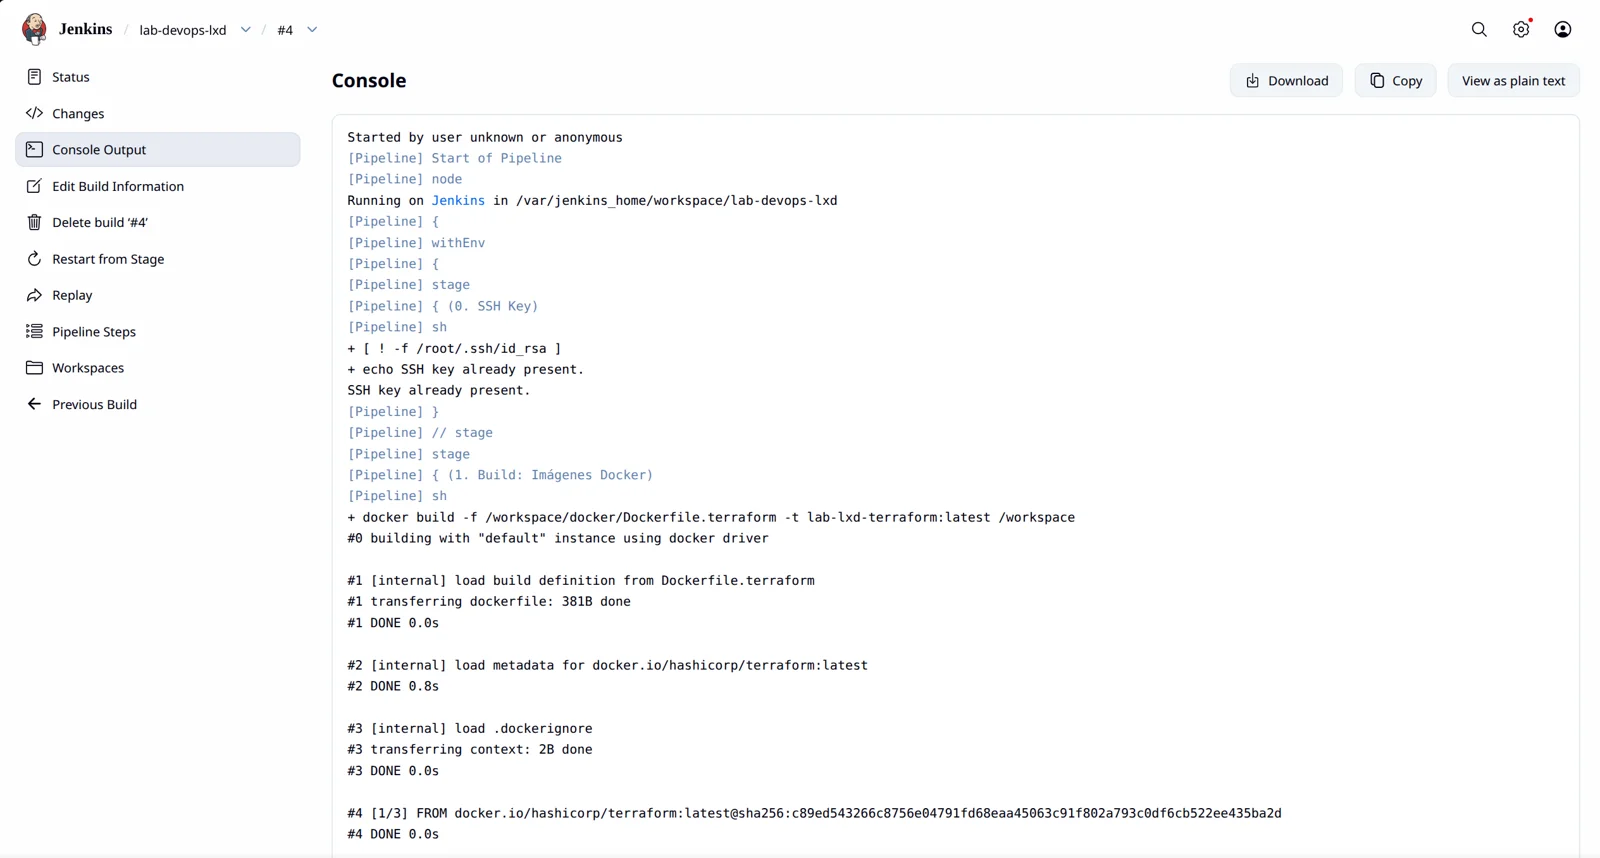
Build #3 failed and #4 succeeded, which is exactly how it went: the first runs uncover the details no tutorial mentions (the apt lock on first boot was one of them), you fix the code, and you run it again. The console output of each run is the step-by-step record of what happened:
And if anything fails, a post { failure } block runs terraform destroy, so a broken run does not leave half-built infrastructure behind:
post {
  failure {
    sh "docker run --rm ... ${TF_IMAGE} destroy -auto-approve || true"
  }
}
That is one of the quiet advantages of IaC: cleaning up is as automatic as building.
Lab shortcuts I would never take in production
To keep the lab simple, some corners were cut on purpose. They are worth naming, because they are exactly what goes wrong when a lab becomes production:
- Jenkins security disabled (no authentication, no CSRF protection). In production: SSO, roles, and the pipeline as the only way to change infrastructure.
- The Docker socket mounted into Jenkins. Anyone who controls Jenkins controls the host. Use dedicated agents instead.
- Default Grafana credentials in the playbook. Use a vault or Ansible Vault and change them on first run.
- SSH host key checking disabled for the freshly created VM. Acceptable for a disposable lab, not for long-lived servers.
- Local Terraform state. In a team, remote state with locking, always.
At work I am applying the same principles at a different scale: defining GitHub organisations and repositories as Terraform code, created through reviewed pull requests instead of clicks in a portal.
How to start without breaking anything
- New things first. Write IaC for the next resource you create, not for everything that exists.
- Import gradually. Bring existing resources under management one by one.
- Remote state with locking from day one.
- CI for plans: every pull request shows the plan as a comment.
- No more manual changes in managed resources, or drift will eat you.
Closing
IaC is not about tools; it is about treating infrastructure as something you can read, review and rebuild. Start small, but start.
Sources