blog / · updated · 15 min read
You need a SIEM. Let's take Wazuh apart to see why
What a SIEM is, what it's made of and why every organisation ends up needing one. Wazuh is our guinea pig, here and in the rest of the series, where we deploy it on Kubernetes as code.
This is the first article in a series about SIEMs, and Wazuh is going to be our guinea pig for all of it. In this one I’ll use it to explain what a SIEM is, which parts it’s made of and why you’d want one in the first place. The next five get hands-on and deploy Wazuh on Kubernetes, entirely as code.
I picked Wazuh because it’s open, every feature is free and the whole platform can live in Git as configuration. I do like it, but that’s a bonus. With Elastic, a lot of the good stuff sits behind licence tiers, and I’d rather not write a series that readers need a subscription to follow. Along the way we’ll also see where Wazuh comes from and where it shines or falls short.
What a SIEM is
A SIEM (Security Information and Event Management) collects logs and events from everything you run, keeps them in one place and looks for patterns that suggest something bad is going on. It boils down to four jobs.
- Collect logs from servers, laptops, firewalls, cloud accounts, SaaS audit logs, Kubernetes and identity providers.
- Normalise a hundred different log formats into fields you can search and correlate, such as user, source IP or action.
- Detect threats with rules. Some match a single event that is always bad, like someone disabling CloudTrail logging. Others look for a pattern across many events, like a burst of failed logins followed by a successful one from a new country.
- Respond by alerting the right people, opening a ticket and keeping the evidence for the investigation.
Here’s the same idea as a picture. There are two ways to run the detection step. The blue path evaluates rules on each event as it arrives, before it’s stored, and that’s how Wazuh works. The amber path stores everything first and runs scheduled queries over it every few minutes, which is the approach Elastic Security and Microsoft Sentinel lean on. Plenty of products offer a bit of both.
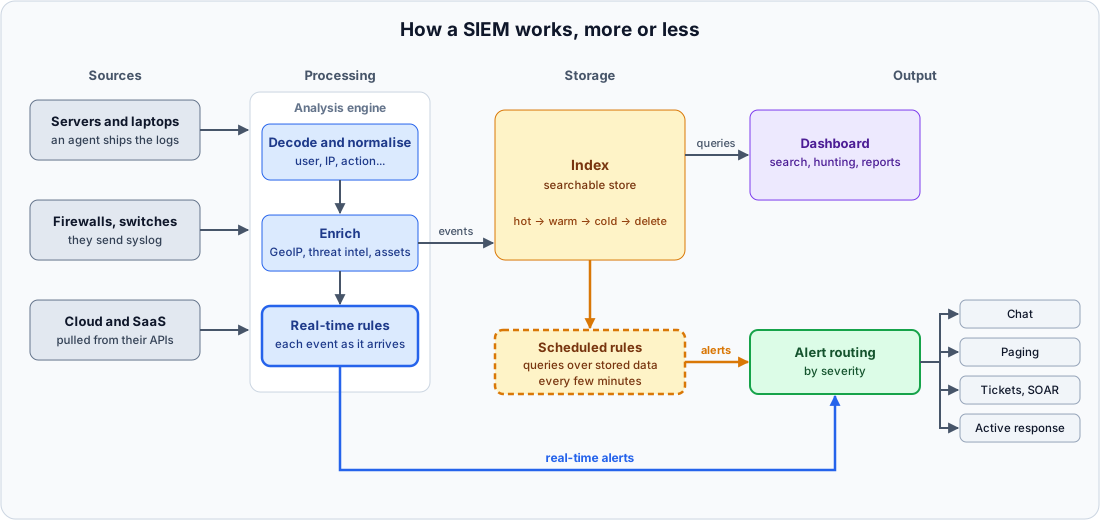
Most modern products go further and add endpoint protection, vulnerability detection, configuration assessment or automated response. That bigger package is usually sold as XDR (Extended Detection and Response), and Wazuh calls itself both.
Why you should have one
I didn’t start with a SIEM. For a while I ran Logstash as a log collector, and it felt like enough. It had input plugins for almost anything, and with a few conditionals and the email output I was getting alerts on CRITICAL and ERROR events. Then I noticed that plenty of sources, SaaS services especially, didn’t follow those conventions at all. And a log collector is just a pipeline. It has no real alerting rules, it doesn’t correlate events across sources, and once an alert arrives it does nothing to help you investigate. That’s when I realised I needed a proper SIEM.
Most organisations learn the same lesson the hard way. After a breach, the evidence usually turns out to have been there all along, in some log on some system, and nobody was looking at it. A SIEM is how you start looking.
- It helps you detect attackers. They often spend days or weeks inside a network before they act, and correlated logs give you a chance to catch them in that window instead of after the ransom note.
- It makes investigation possible. When something happens, the first questions are always since when, who, and what else they touched. Without central logs, the answers depend on which systems happened to keep theirs.
- It covers compliance. ISO 27001, NIS2, PCI DSS, TISAX and most sector regulations expect you to collect, protect and review security logs, and a SIEM is the usual way to prove you do.
- It gives you visibility even when nobody is attacking you. You’ll find the service account that logs in at 3 a.m., the forgotten server getting SSH brute-forced every minute and the cloud account nobody remembers creating.
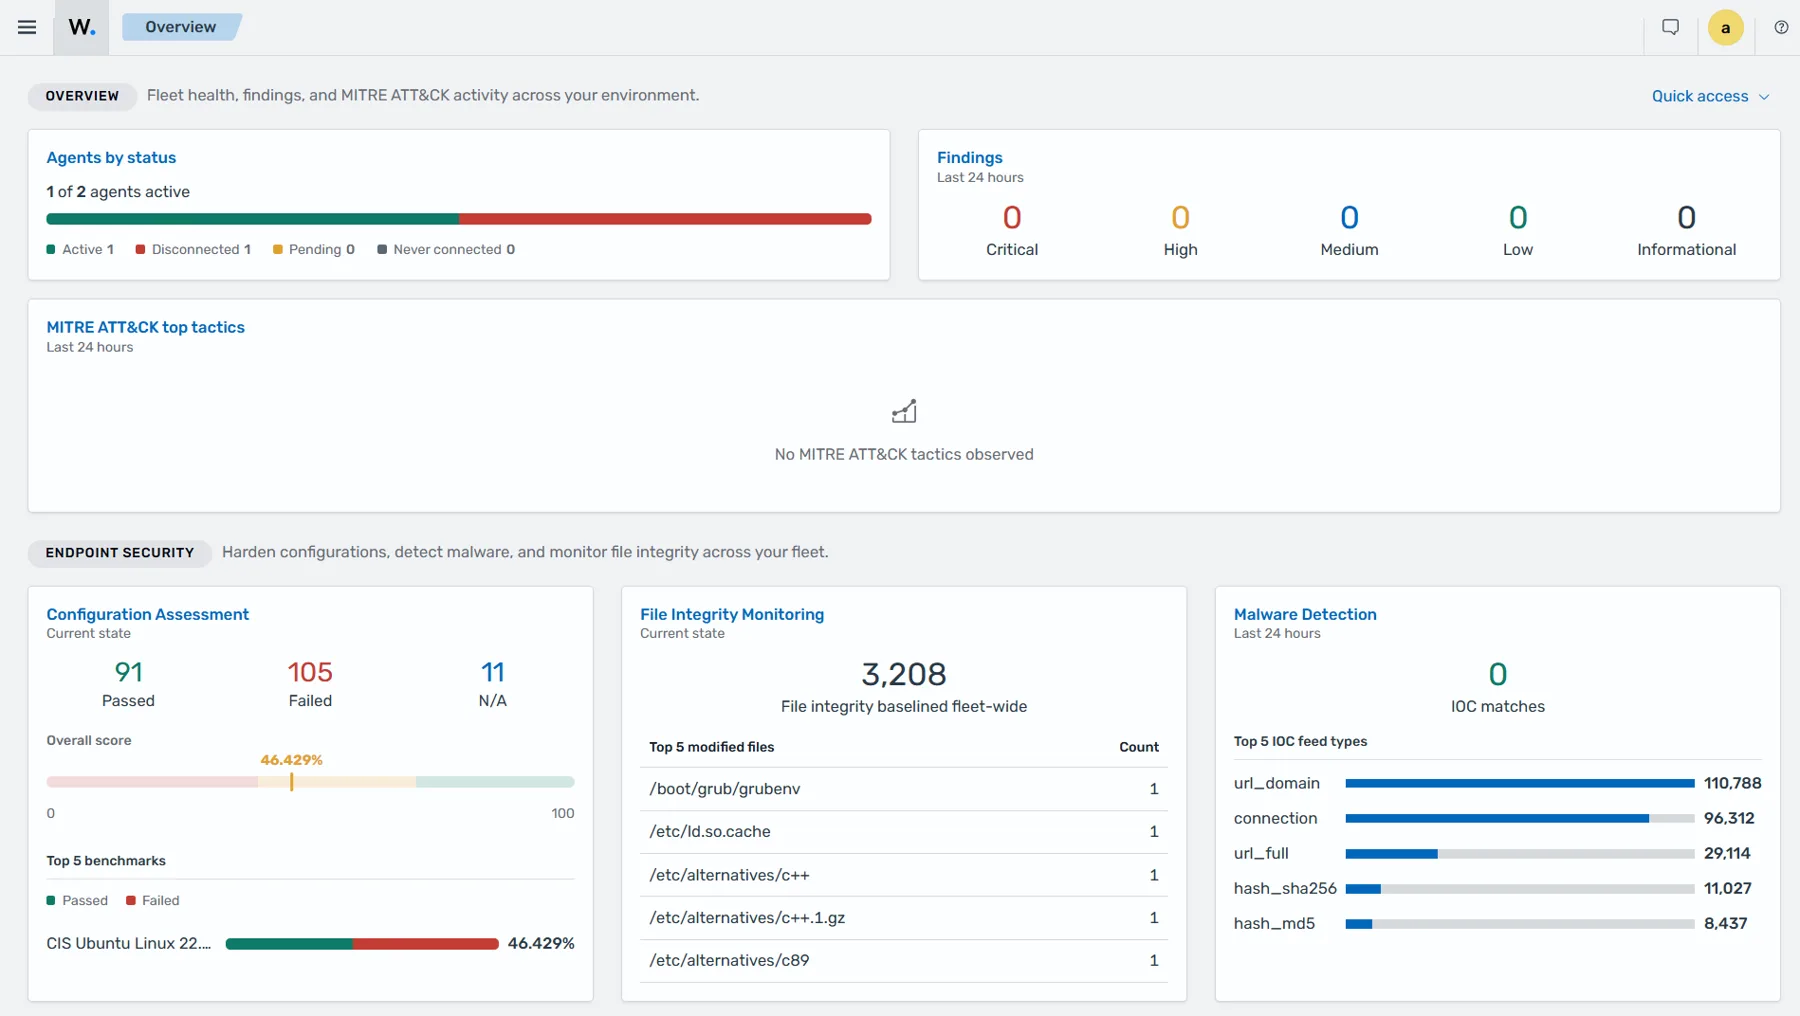
Image from the Wazuh documentation, © Wazuh, Inc., licensed under the GNU GPL v2. The documentation shows the latest version, so the screens in the Kubernetes series (Wazuh 4.14) look slightly different.
The parts of a SIEM, Wazuh edition
Every SIEM is built from the same basic pieces. Something has to collect events on the endpoints, something has to process them and decide what counts as an alert, something has to store them, and someone needs a screen to look at it all. Wazuh calls those pieces the agent, the manager, the indexer and the dashboard.
| Component | What it does |
|---|---|
| Agent | Runs on endpoints (Linux, Windows, macOS and others). It collects logs, monitors file integrity, inventories software, checks configuration, detects vulnerabilities and can run active responses |
| Manager (server) | Receives events from agents and other sources, decodes them, applies the rules and generates alerts |
| Indexer | Stores alerts and events and makes them searchable |
| Dashboard | The web interface, with searches, dashboards and the Wazuh modules (MITRE ATT&CK, compliance, vulnerabilities and so on) |
The interesting design choice is where detection happens. In Elastic and OpenSearch, detection rules usually run on data that’s already in the index. In Wazuh, the manager decodes and evaluates every event before anything reaches the indexer. Decoding, enrichment and rule evaluation all happen in the manager, and only normalised events and alerts travel on to the indexer.
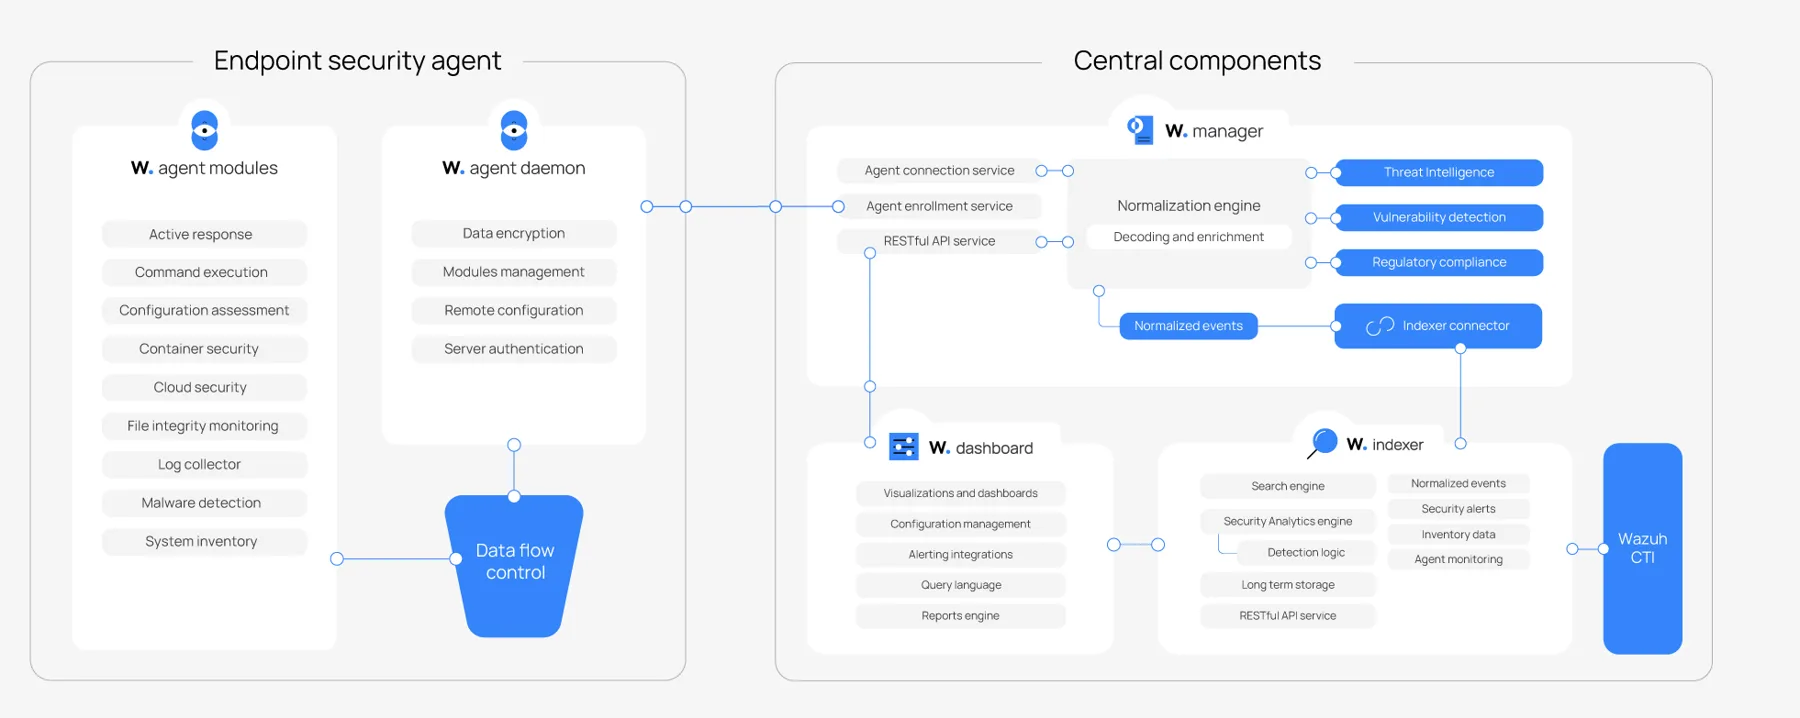
Image from the Wazuh documentation, © Wazuh, Inc., licensed under the GNU GPL v2.
Wazuh also ships with thousands of rules, file integrity monitoring, configuration checks against CIS benchmarks, vulnerability detection, compliance mappings for PCI DSS, GDPR, HIPAA and NIST 800-53, and integrations with the main cloud providers.
How events flow
Here is how the four jobs of a SIEM map to those pieces. Events arrive from agents, network devices and cloud services. The manager decodes and evaluates them, the indexer stores the alerts, and the alerting outputs make sure someone acts on them.

Agents enrol with the manager on port 1515 and then send their events over an encrypted channel on port 1514. Devices that can’t run an agent send syslog instead. Cloud and SaaS sources work the other way round, because the manager pulls them on a schedule through modules and wodles. That’s why their configuration lives on the manager rather than on any agent. Alerts can also go to several places at once. The same alert can post to a chat, page someone, open a ticket and trigger an active response back on the endpoint.
What a rule looks like
Rules are plain XML. This one ships with Wazuh, and it’s the “burst of failed logins” from the start of the article. Rule 5760 fires on every failed SSH login. Rule 5763 builds on it and raises a level 10 alert when the same source IP fails eight times in two minutes, then stays quiet for a minute so it doesn’t flood you. It also tags the alert with the MITRE ATT&CK technique for brute force.
<rule id="5763" level="10" frequency="8" timeframe="120" ignore="60">
  <if_matched_sid>5760</if_matched_sid>
  <same_source_ip/>
  <description>sshd: brute force trying to get access to the system. Authentication failed.</description>
  <mitre>
    <id>T1110</id>
  </mitre>
</rule>
Trimmed from 0095-sshd_rules.xml in the Wazuh ruleset, GPL v2.
Your own rules follow the same format. They go in /var/ossec/etc/rules/local_rules.xml and use IDs from 100000 upwards so they never clash with the built-in ones. Part 4 takes this further and keeps every rule in Git.
That XML format belongs to Wazuh, though. If you want rules that travel between SIEMs, the community writes them in Sigma, a vendor-neutral YAML format with more than 3,000 shared rules that you can convert to many SIEM query languages. I wrote about it in Sigma Rules.
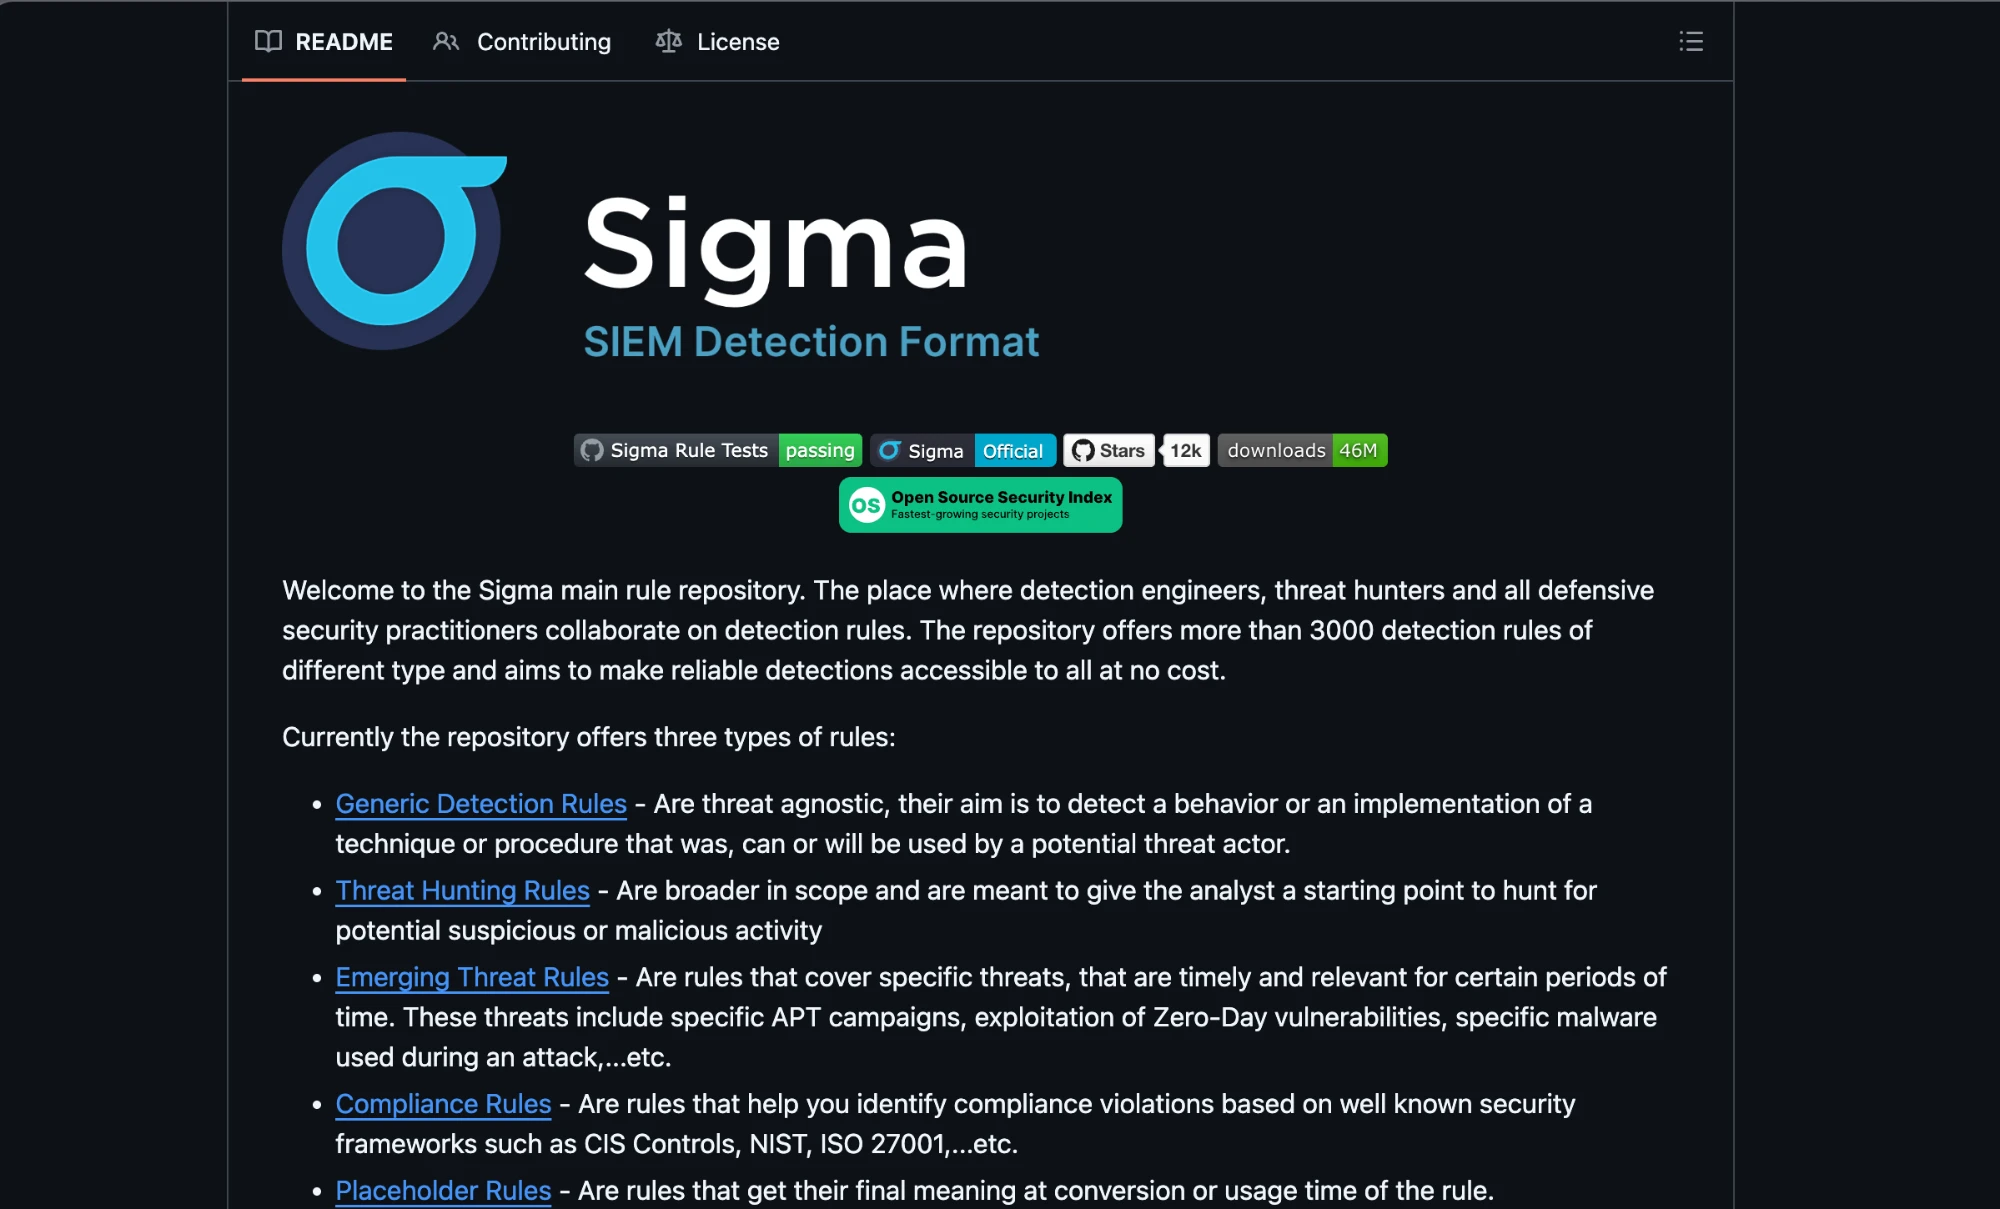
Rules for thee, rules for me. The SigmaHQ/sigma repository on GitHub.
Alerts people actually read
Most of the talk around SIEMs is about the input side, which sources to collect and how to parse them. The output gets far less attention, and it’s the only part most people ever see. If the alerts are noisy, nobody will care how good the pipeline behind them is.
That’s alert fatigue, and it’s how SIEMs die quietly. When a chat channel gets two hundred alerts a day and almost all of them are harmless, people mute it. A week later the one alert that mattered lands in the same channel and nobody reads it. A SIEM nobody tunes ends up as an expensive log archive that sends alerts nobody reads. Installing the tool is the easy part. The rules, the tuning and the people who look at the alerts are what make it work.
A few habits help keep alerts meaningful.
- Pick rules that matter to you. Wazuh ships thousands of rules, and plenty of them cover software you don’t run or situations you don’t care about. Start from the threats that fit your environment, which is also where community rules like Sigma help.
- Silence known noise on purpose. In Wazuh, a custom rule with level 0 matches an event and drops it, so you can mute a chatty source without touching the built-in rules. Keep those rules in Git with a comment saying why, so every silence is a decision someone can review.
- Route by severity. Every Wazuh rule has a severity level. The shipped
ossec.conflogs alerts from level 3 and only sends email from level 12, and each integration (Slack, PagerDuty and the rest) takes its own minimum level. Page someone only for what needs a human right now, send the rest to a chat or a ticket, and leave the low-level stuff in the dashboard for hunting. - Write alerts a tired person can act on. The rule description is what shows up on a phone at 3 a.m. It should say what happened and on which host or account, and the alert should carry enough fields to start investigating without opening five consoles.
Whenever an alert fires and nobody needs to do anything about it, ask whether it should exist at all. Part 5 wires up Slack and JSM Operations, with the routing kept in Git like everything else.
A family tree with two roots
Wazuh sits where two separate lineages meet, and knowing both explains a lot about how it behaves.
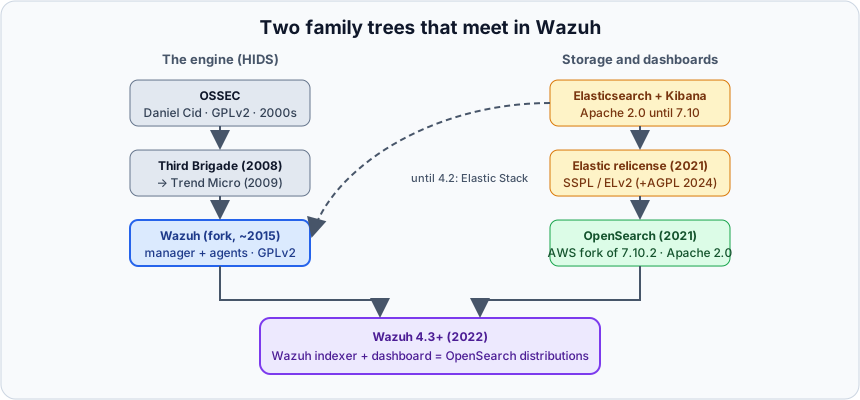
“Two households, both alike in dignity.” William Shakespeare, Romeo and Juliet.
The detection engine comes from OSSEC, an open-source host-based intrusion detection system (HIDS) that Daniel Cid created and released under the GPLv2. It became very popular for log analysis and file integrity monitoring. Third Brigade acquired it in 2008, Trend Micro bought Third Brigade a year later, and development slowed down. Around 2015 Wazuh started as a fork to modernise it, adding a RESTful API, cluster support, new modules and, most importantly, integration with a proper search engine. The rules, the decoders and the ossec.conf file you still edit today all come from that heritage.
Storage and dashboards come from Elasticsearch. For years Wazuh ran on the Elastic Stack, sending alerts to Elasticsearch and shipping its interface as a Kibana plugin. In 2021 Elastic moved Elasticsearch and Kibana from Apache 2.0 to a dual SSPL and Elastic License, and neither counts as open source. AWS responded by forking the last Apache-licensed version (7.10.2) into OpenSearch, which is now run by the OpenSearch Software Foundation under the Linux Foundation.
Wazuh 4.3, released in May 2022, switched sides. The Wazuh indexer and Wazuh dashboard are now distributions of OpenSearch and OpenSearch Dashboards, with Wazuh’s own plugin and tooling on top. That’s why the Kubernetes series is full of OpenSearch APIs, OpenSearch plugins like repository-s3, and OpenSearch policies for snapshots and index lifecycle.
As a footnote, in 2024 Elastic added AGPLv3 as a licensing option for the source code of Elasticsearch and Kibana, so there’s an OSI-approved open source way to use them again. The binaries you download are still under the Elastic License by default. By then the fork had a life of its own.
Strengths
- It’s free and open source. There are no per-agent licences, no per-gigabyte ingestion fees and no features locked behind a subscription. For small and medium teams, that alone often settles it.
- It’s a complete platform from day one. File integrity monitoring, vulnerability detection, configuration assessment, compliance dashboards and MITRE ATT&CK mapping are all included, with no paid add-ons.
- The agent does real work on the host. Besides shipping logs, it inspects the machine and can run active responses, such as blocking an IP or killing a process.
- You can read and version the rules. As you saw above, they’re plain XML files, which makes detection as code feel natural. You review them in pull requests, test them and deploy them like any other code.
- Cloud integrations come included, with native support for AWS, Azure, Google Cloud, GitHub, Office 365 and others.
- The community is large, and there’s plenty of documentation and examples to learn from.
Weaknesses
Wazuh is excellent value, but it isn’t perfect, and some of its limits only show up once you run it seriously.
- There’s nothing like Elastic Fleet. Elastic lets you manage agent policies, integrations and upgrades from a single interface. Wazuh gives agents centralised configuration through groups (
agent.conf), and that works, but upgrading agents, managing integrations and handling collectors at scale is far more manual. You’ll end up leaning on your own tooling, whether that’s MDM, Ansible or scripts. - There’s no official Kubernetes operator. Wazuh publishes official Kubernetes manifests and the community maintains Helm charts, but nothing manages the lifecycle (scaling, upgrades, certificates, backups) for you. Whatever an operator would automate, you have to build yourself. That’s a big part of what the rest of the series does with GitOps.
- The choice of collectors is limited. The agent covers the main operating systems, but for anything else you’re mostly down to syslog, reading log files, or the integrations Wazuh ships. Elastic’s catalogue has hundreds. There’s an example of what that looks like right below.
- Wodles feel like a world of their own. Cloud and third-party integrations (AWS, Azure, Google Cloud, Docker, osquery, command execution and more) are implemented as wodles. Many of them are Python modules, and each one has its own block in
ossec.conf, its own options, its own quirks and its own ways of failing. They do work, but they don’t feel like one coherent system, and debugging one means learning its internals. The GitHub module, for example, only talks toapi.github.comand can’t be pointed anywhere else. - The OSSEC heritage shows.
ossec.conf, XML rules, numeric rule IDs and the decoder hierarchy are powerful but dated, and the learning curve is real, especially for decoders. - Scaling the indexer is your problem. Underneath it’s OpenSearch, with everything that comes with it, from shards and heap sizing to storage, snapshots and lifecycle policies.
An example, Suricata on pfSense
Here’s what the collector limitation looks like when you run into it. For a course, I built a small network lab in GNS3 with a pfSense firewall at the perimeter running Suricata as the intrusion detection system, an attacker on the internet side throwing scans, brute force and floods at it, and Wazuh as the SIEM on the internal network. The goal was simple. Every time Suricata spotted something, the alert should show up in Wazuh next to everything else.
The usual way to do that is to install the Wazuh agent on the firewall and point it at Suricata’s eve.json. That didn’t work here. The Wazuh agent package for pfSense was built for FreeBSD 14 and the firewall ran FreeBSD 15, so the agent was out. Suricata’s own syslog output didn’t help either, because switching the EVE output to syslog meant losing the local eve.json, and Wazuh couldn’t parse what came out.
So I built the collector myself. A small shell script on the firewall tails eve.json and forwards each line to Wazuh over syslog, with a watchdog that restarts it if it dies. On the Wazuh side, a one-line custom decoder hands the payload to the JSON decoder. It works fine, and the screenshot below is the result. It’s also exactly the kind of glue you wouldn’t have to write with a broader collector ecosystem. The whole lab, custom Suricata rules included, gets its own article after the series.
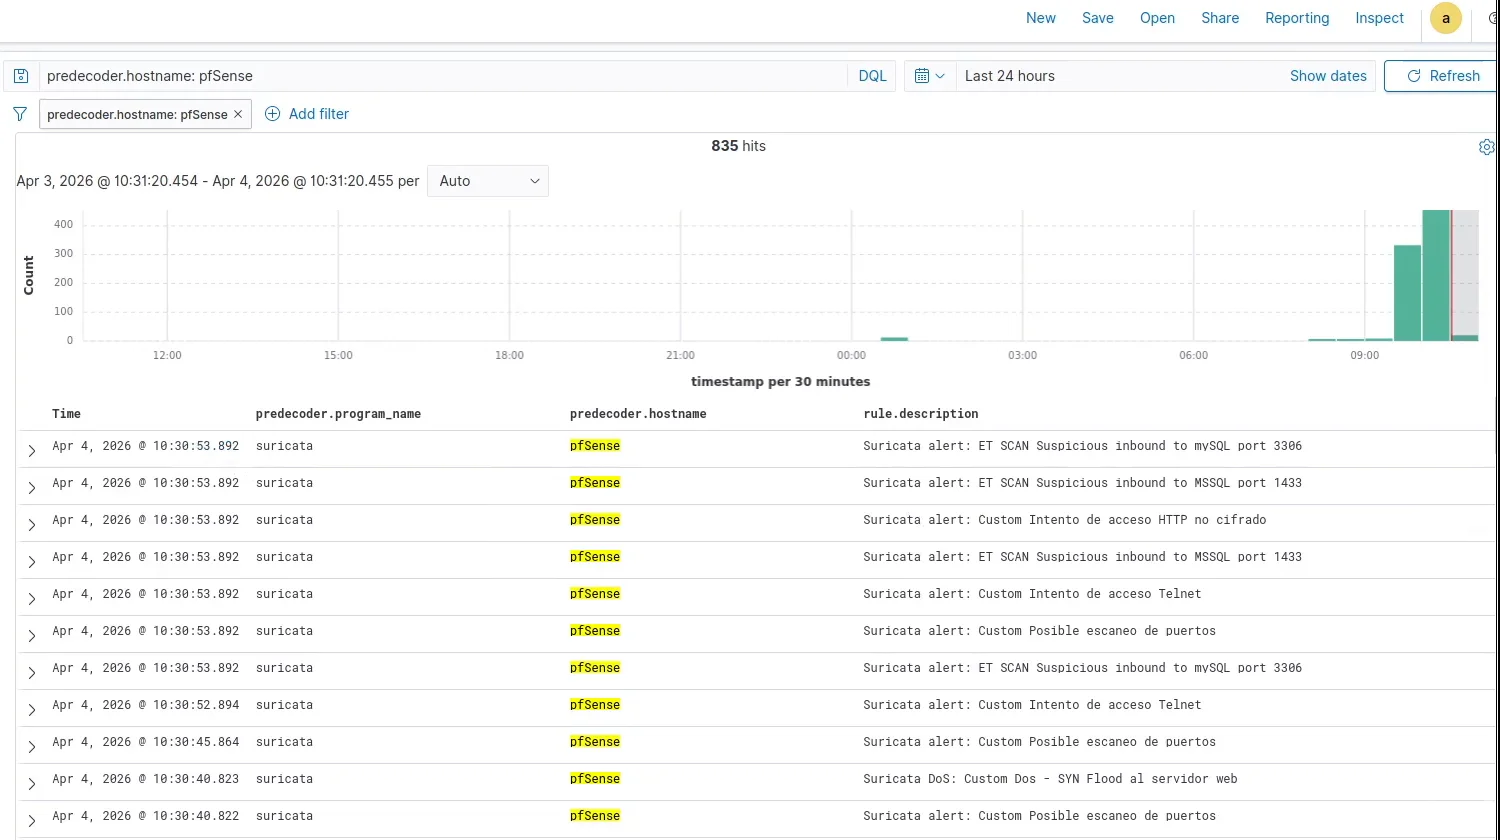
Suricata alerts from the pfSense firewall arriving in Wazuh through the syslog bridge. Some assembly required, screwdriver not included.
When Wazuh makes sense
Even with all of that, I think Wazuh is worth it, and it’s a strong choice if:
- Budget matters and you’d rather spend on people and time than on licences
- You want endpoint visibility (FIM, vulnerabilities, configuration) on top of log analysis
- You’re comfortable running infrastructure, or willing to automate it
- You care about owning your data and your detection rules
It’s a weaker fit if you want a fully managed service with no infrastructure to run, if you have very large ingestion volumes and little capacity to operate them, or if you need the broad catalogue of ready-made integrations that commercial SIEMs offer.
Running Wazuh yourself is self-hosting, with everything that comes with it, from the time it takes to the upgrades and the technical debt. I wrote about when that pays off and when a subscription ends up cheaper in Self-hosting or SaaS.
Next
The next article, Part 1, starts the actual deployment, with Wazuh on Kubernetes built entirely from Git and running on any cluster, from the certificates to the detection rules. The lifecycle gaps I listed as weaknesses are exactly what the series sets out to automate.
After the series I’ll tell the story of my first SIEM, built on Elastic with a fair amount of duct tape, and compare Wazuh, Elastic and Microsoft Sentinel side by side.
Sources
- Wazuh documentation (component diagram and dashboard screenshot, GPL v2)
- Wazuh documentation: Custom rules
- Wazuh documentation: Rules classification
- Wazuh documentation: alerts section of ossec.conf
- Wazuh: Introducing Wazuh 4.3.0
- Wazuh: Migrating from OSSEC to Wazuh
- Wikipedia: OSSEC
- Wikipedia: OpenSearch
- Elastic: Licensing FAQ
- Elastic: Fleet and Elastic Agent